SEED
intro
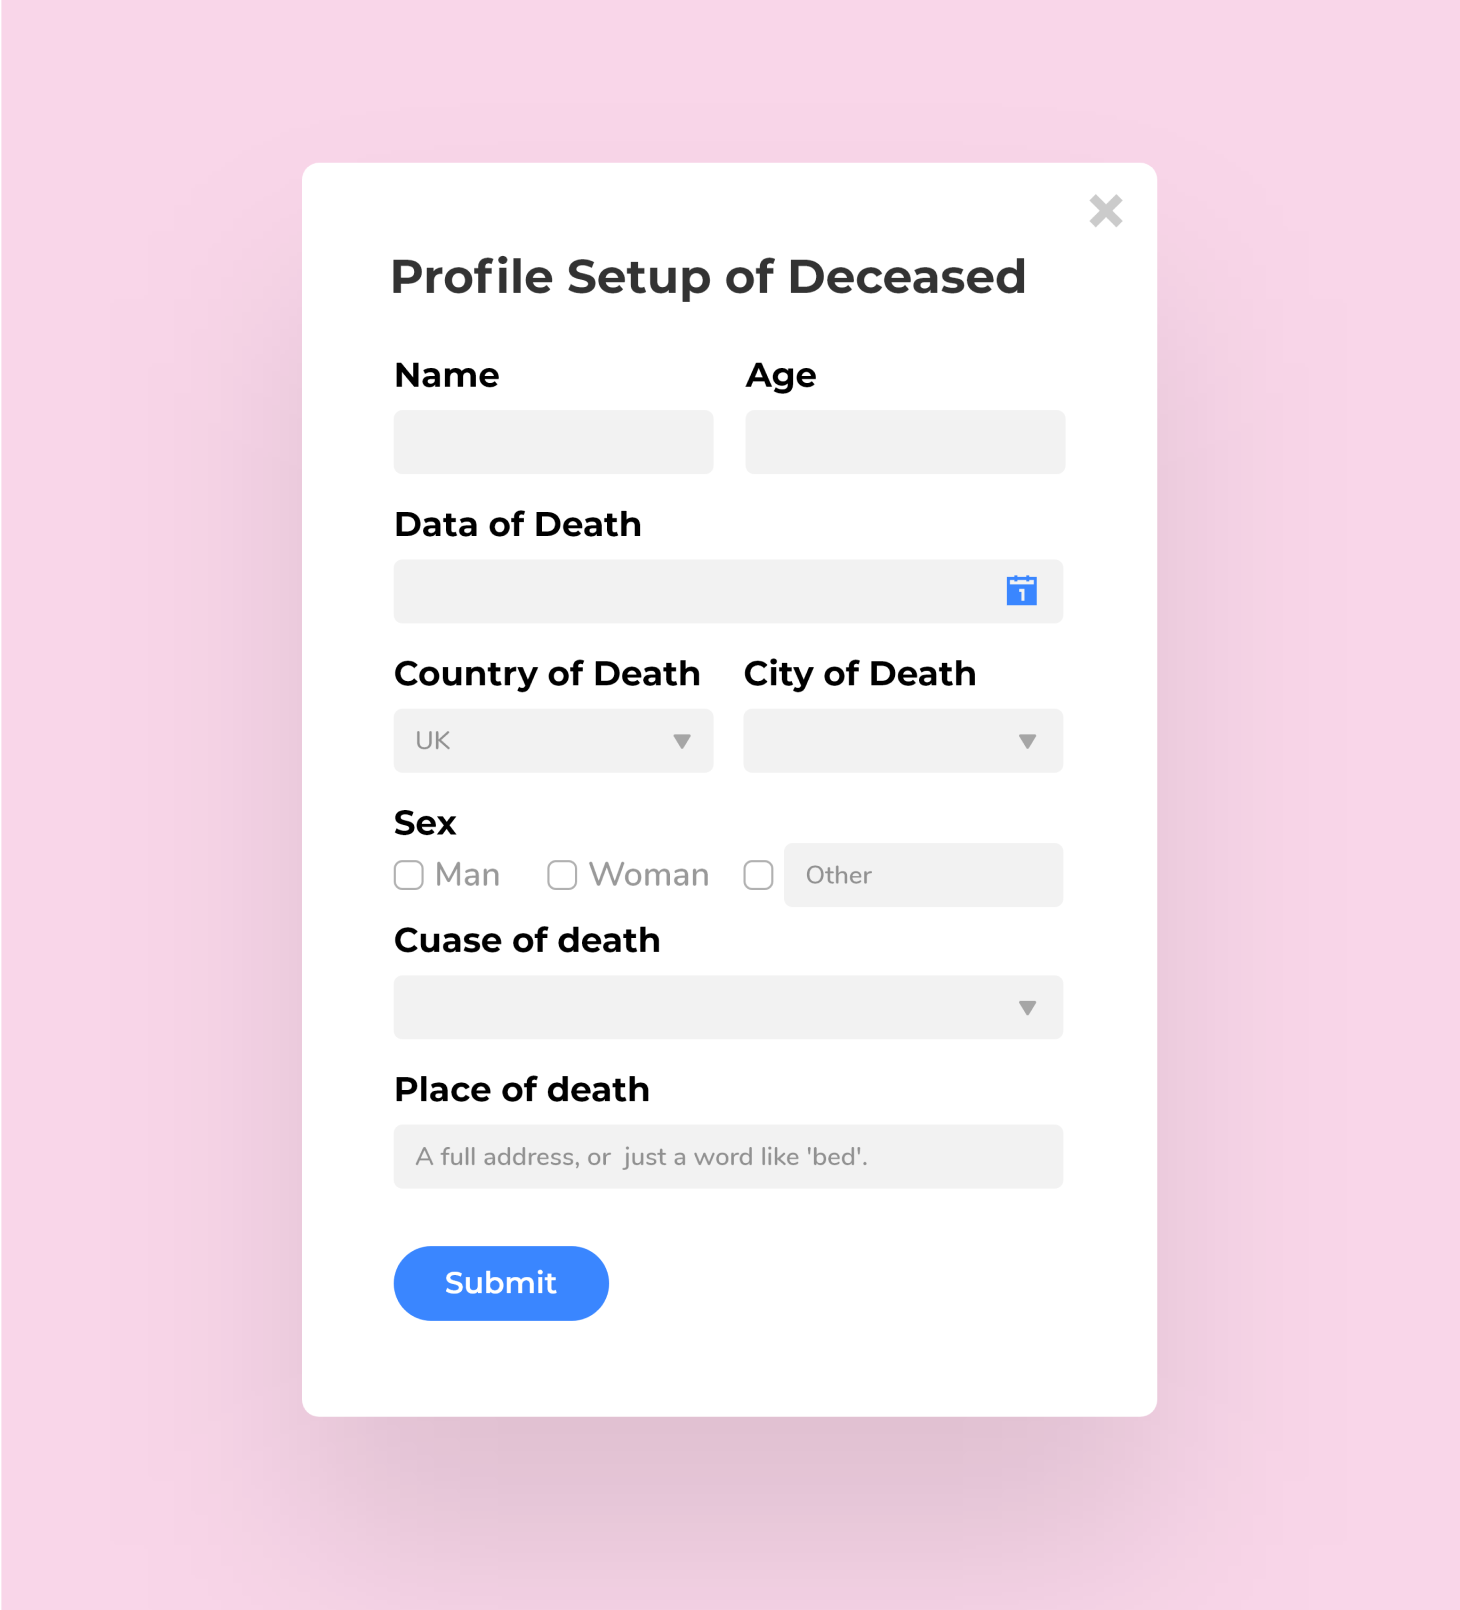
SEED is a data platform and digital space memorial used to collect and record deaths during the pandemic and visualize user-uploaded information. Users can share their memories and thoughts about their loved ones here to release suppressed emotions. They can also browse others' stories, find resonance, and offer flowers in mourning. This project explores the evolution of user emotions. In addition to initial desk research and surveys, we also obtained more professional guidance through interviews with psychological experts.
WHAT I DID
UI/UX Design, Website Design, Data Visualization, Illustration
Year
2022
Process
Challenges and Goals
Losing loved ones during the pandemic is more difficult to bear than usual. Due to isolation policies, friends and family cannot communicate with critically ill patients. Lockdown and funeral policies have prevented the expression and alleviation of this trauma. We can foresee a significant increase in trauma cases in the future. Therefore, finding and establishing mechanisms to cope with grief can help alleviate mild mental health issues.
Solution
Combining aspects of memorials and AA support groups, we created a visual digital monument. This is a platform for posting, expressing, and supporting each other. The emotional process follows some simple trauma recovery guidelines, which can be roughly divided into several stages: creating an environment, recalling and acknowledging the harm, mourning, and finding connection.
Visual and Interaction Design
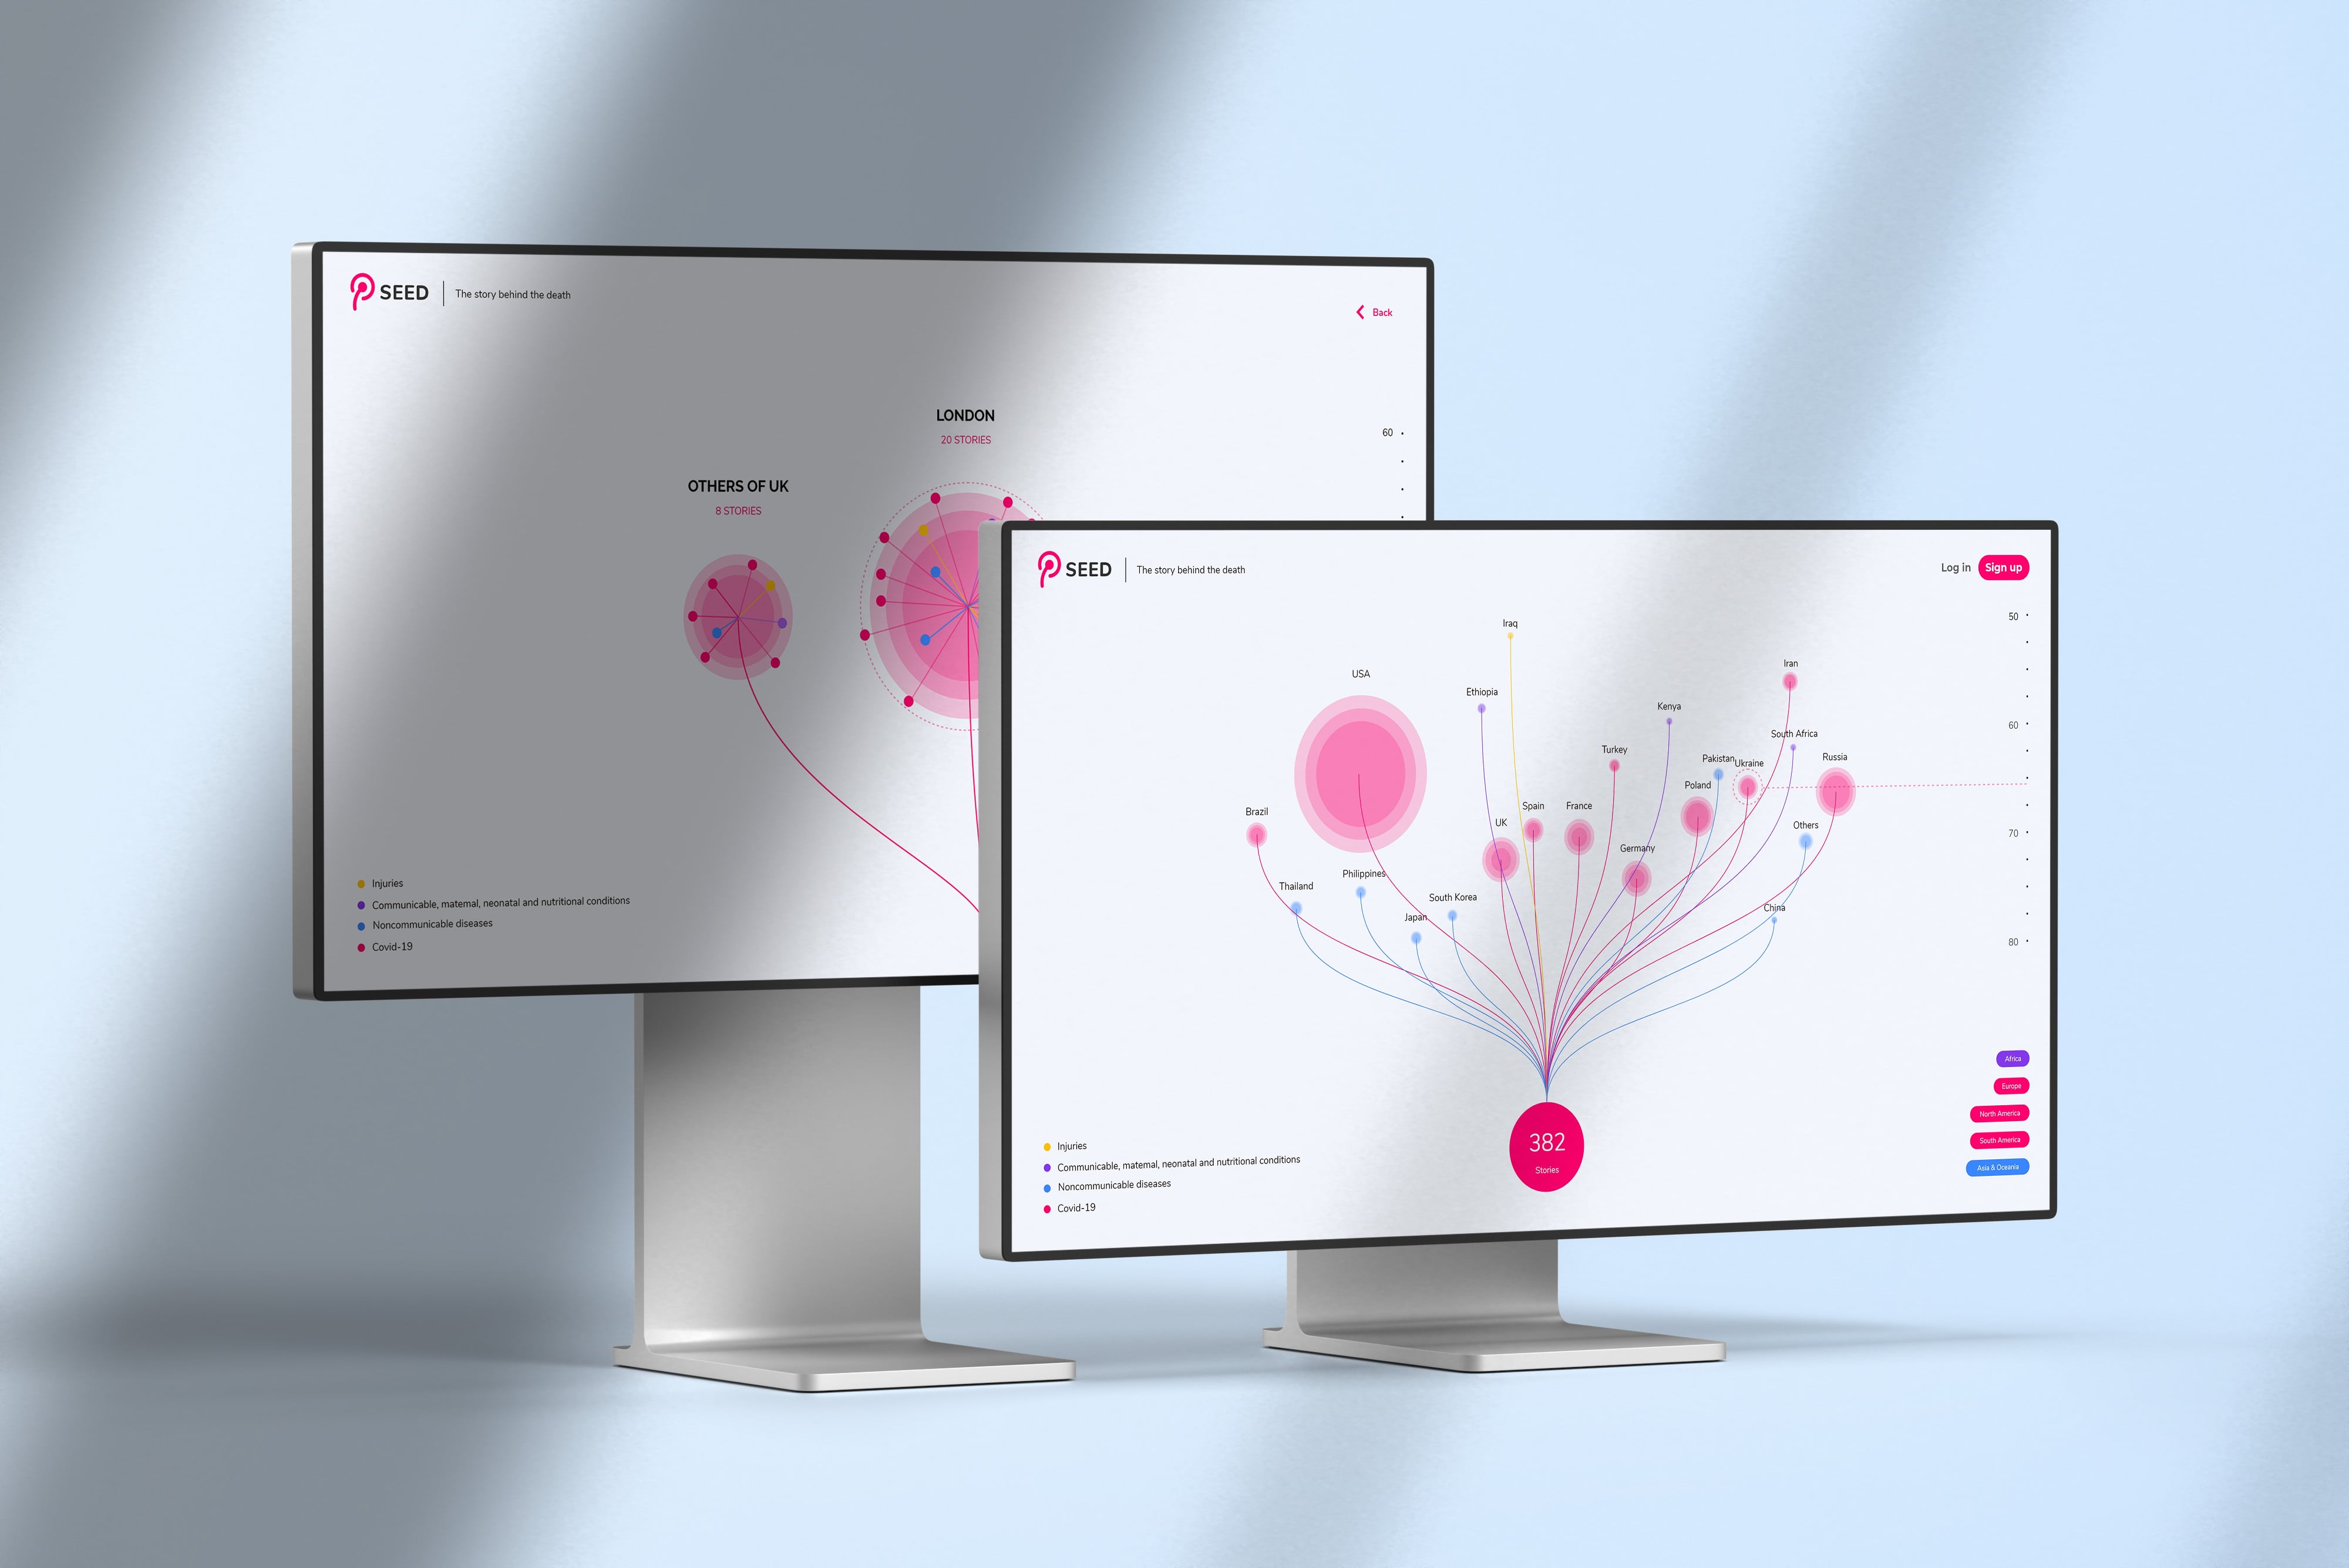
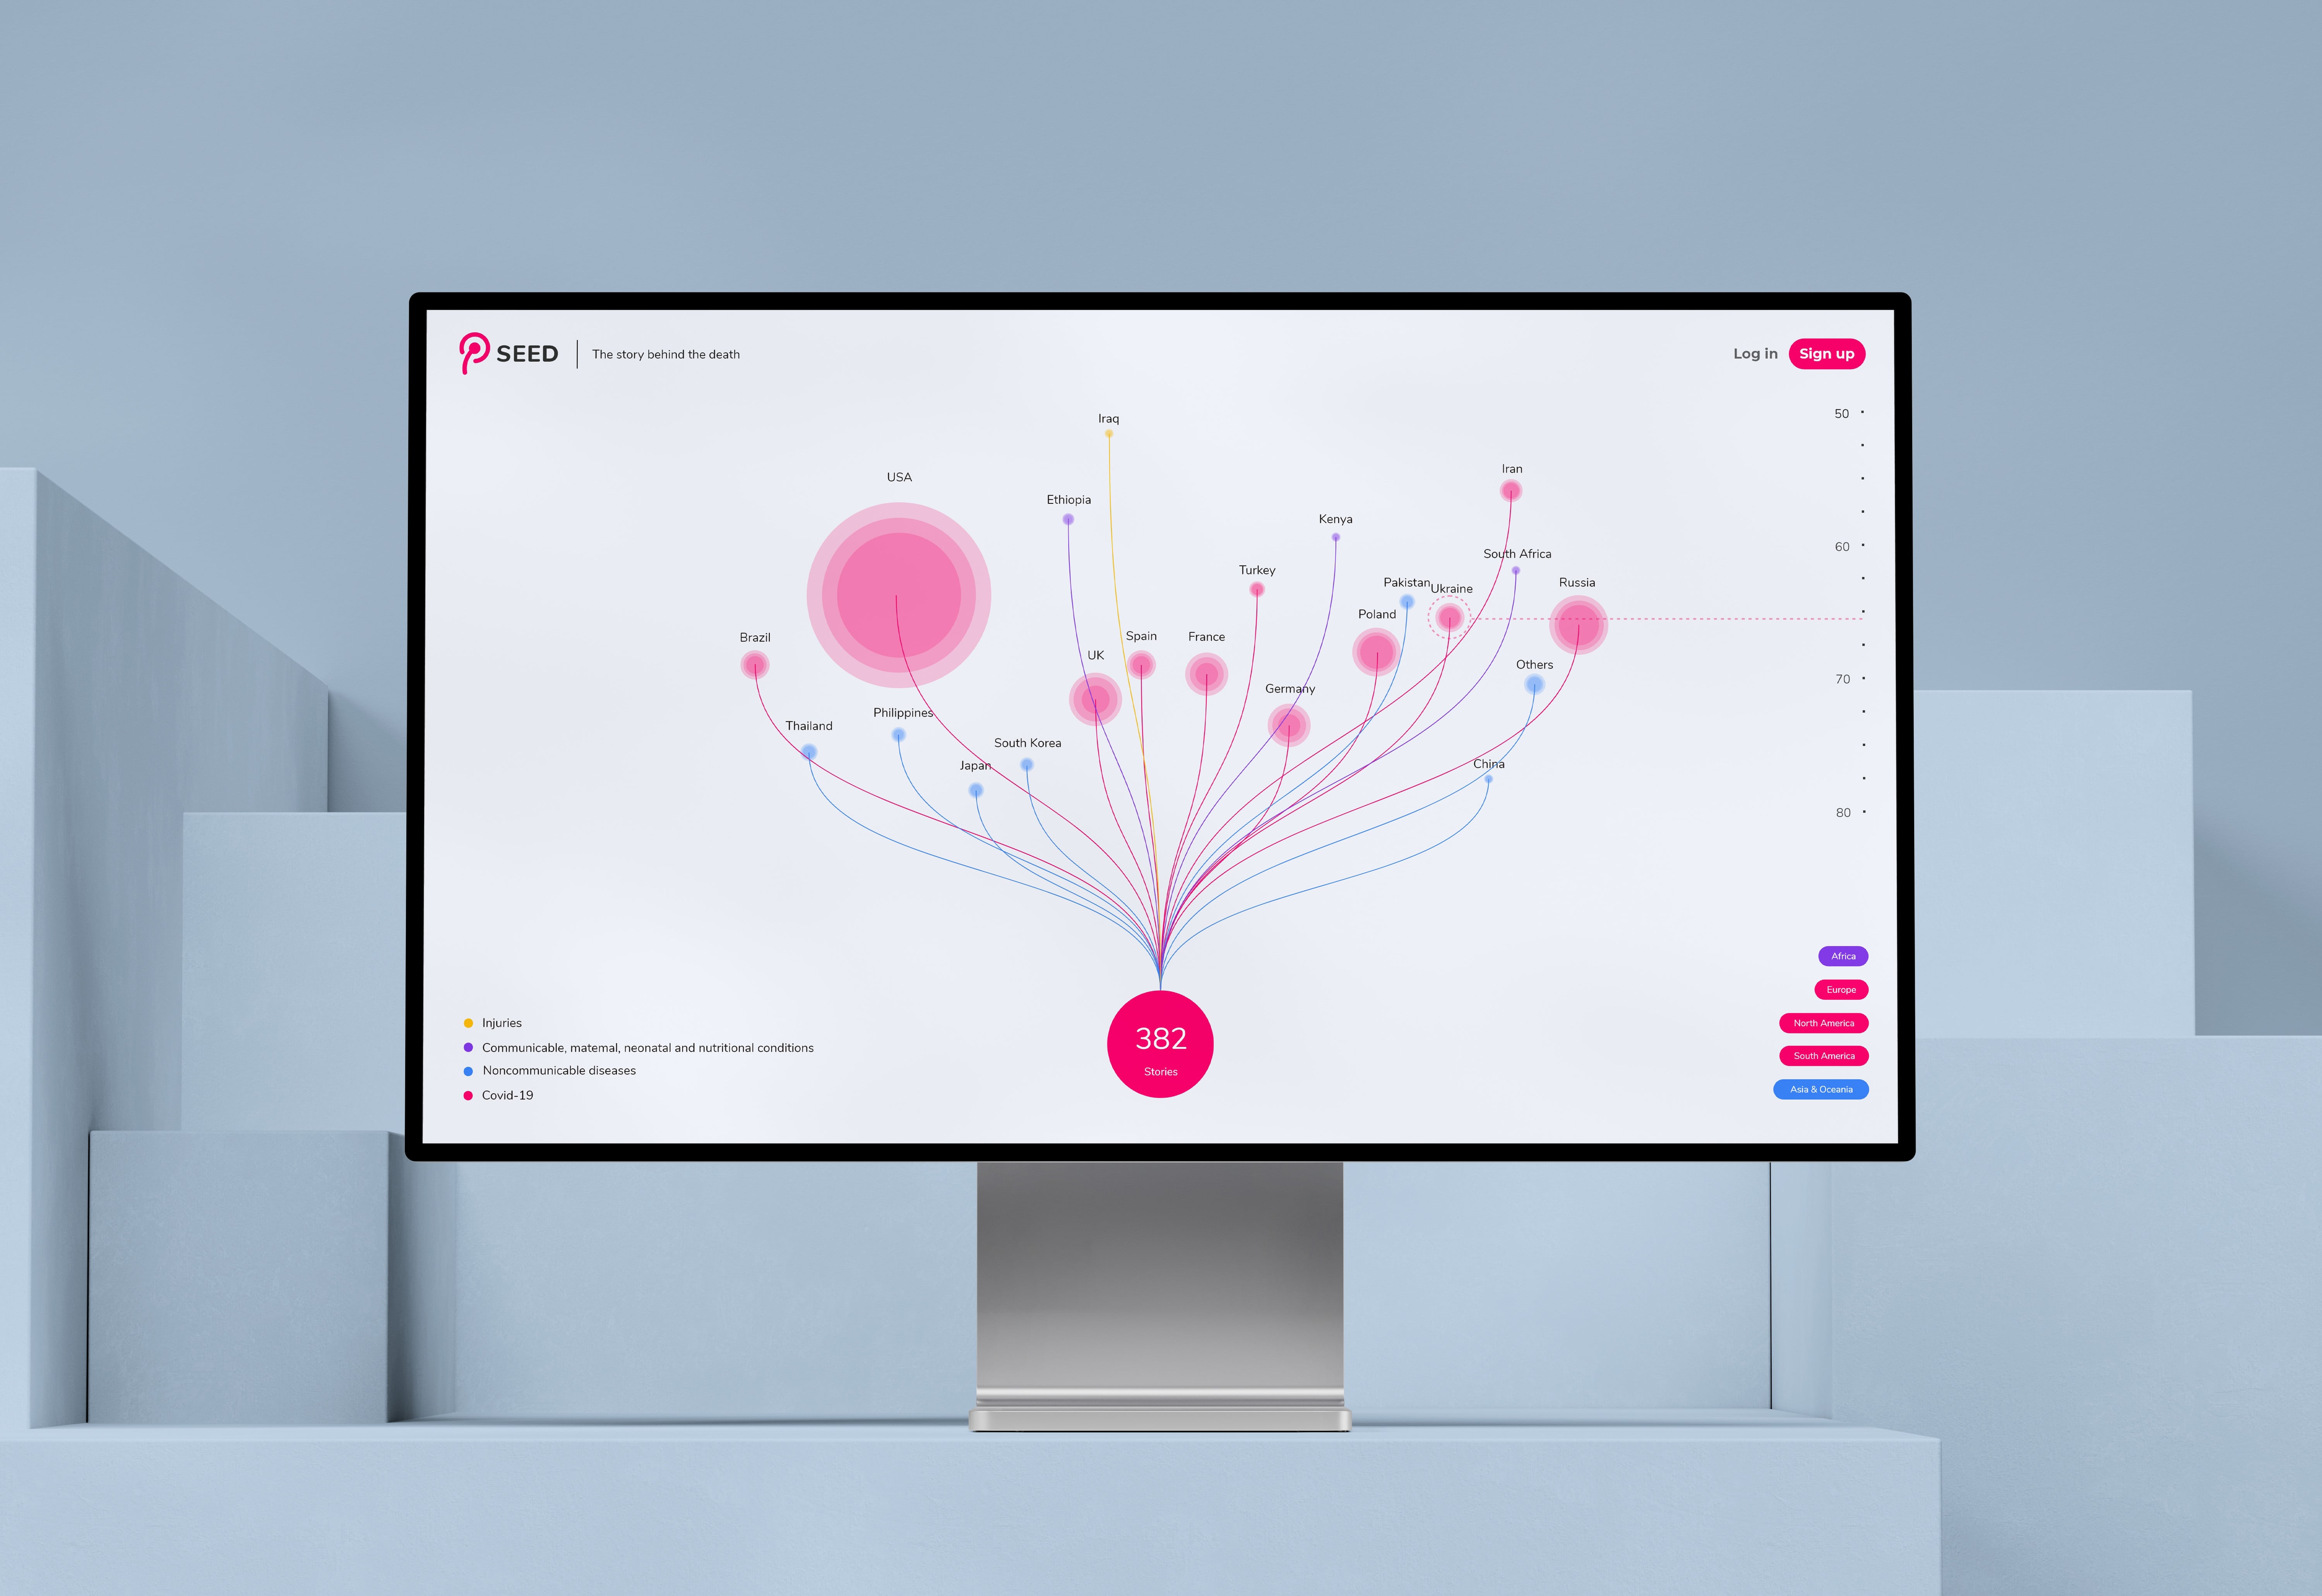
I experimented with various visual forms to display user data and information and finally decided that a dandelion was an elegant and feasible design direction. On one hand, its spread, growth, and dispersal are similar to the coronavirus, but on the other hand, its imagery is more positive and healing, symbolizing that people will eventually move on from grief. The exploration of data interaction forms included several other ideas. For example, the death information of a country or region can be further subdivided to form new branches. By zooming in and out on the dandelion with a scroll wheel, users can observe age layers and the lengths of flower stems, seeing both the age at death of individual deceased and intuitively feeling the death trends of an entire region. Additionally, according to the World Health Organization (WHO) statistics and cause of death classification standards, I used different colors to represent different causes of death. Therefore, when users browse this digital platform, the overall color of the dandelion will reflect the primary causes of death in a specific region.
Feedback and Modifications
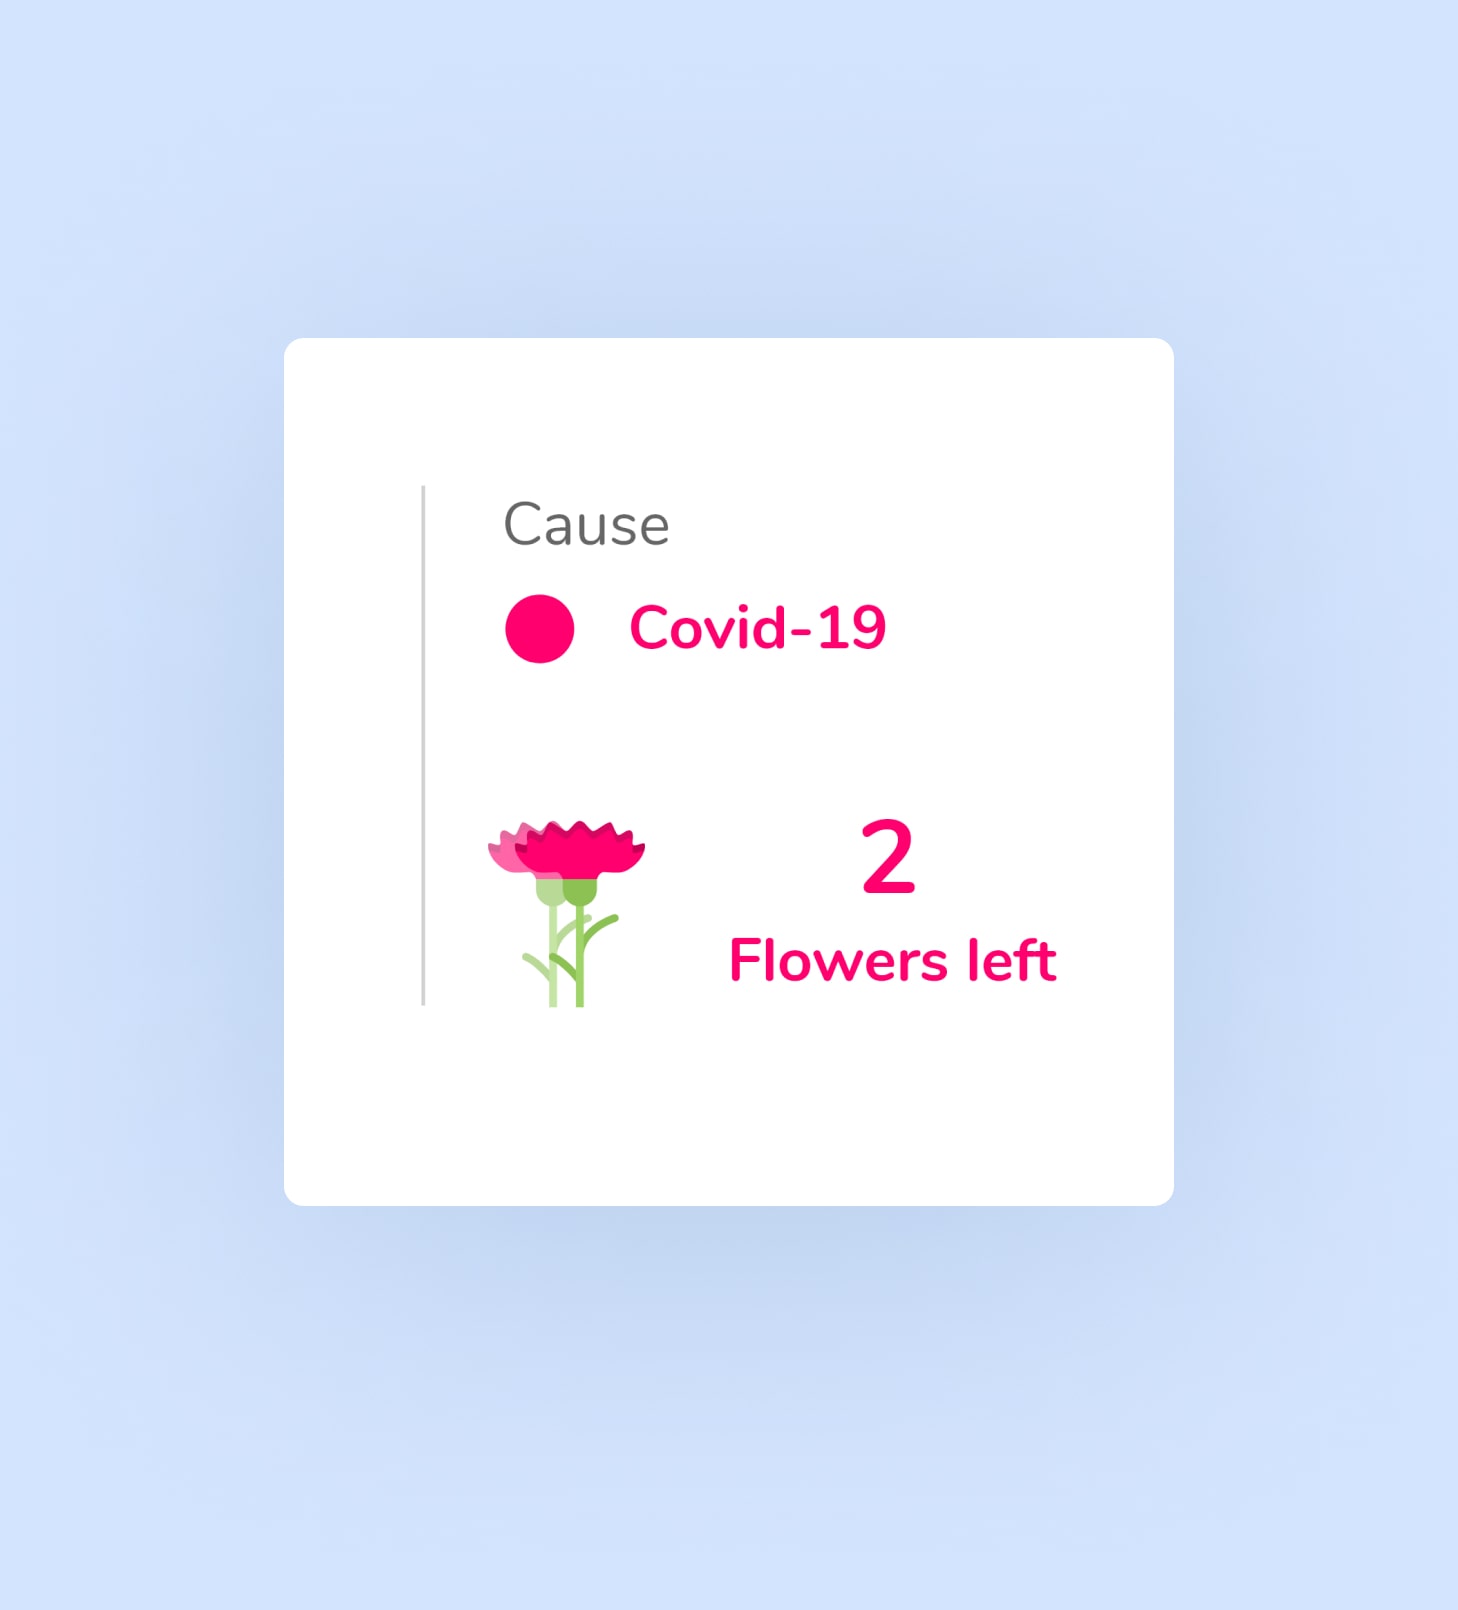
Whether to display the number of flowers was an interesting question. Some users felt that showing specific numbers was necessary, while others thought it was unfriendly to users who did not receive flowers. Ultimately, I adopted the latter approach for the following reasons: 1. Flowers randomly disappear after being viewed, so showing specific numbers becomes meaningless as they will eventually reset to zero. 2. Considering some users might not receive flowers, the system will automatically send flowers at appropriate times.
OUTCOME


