WIL Cube
intro
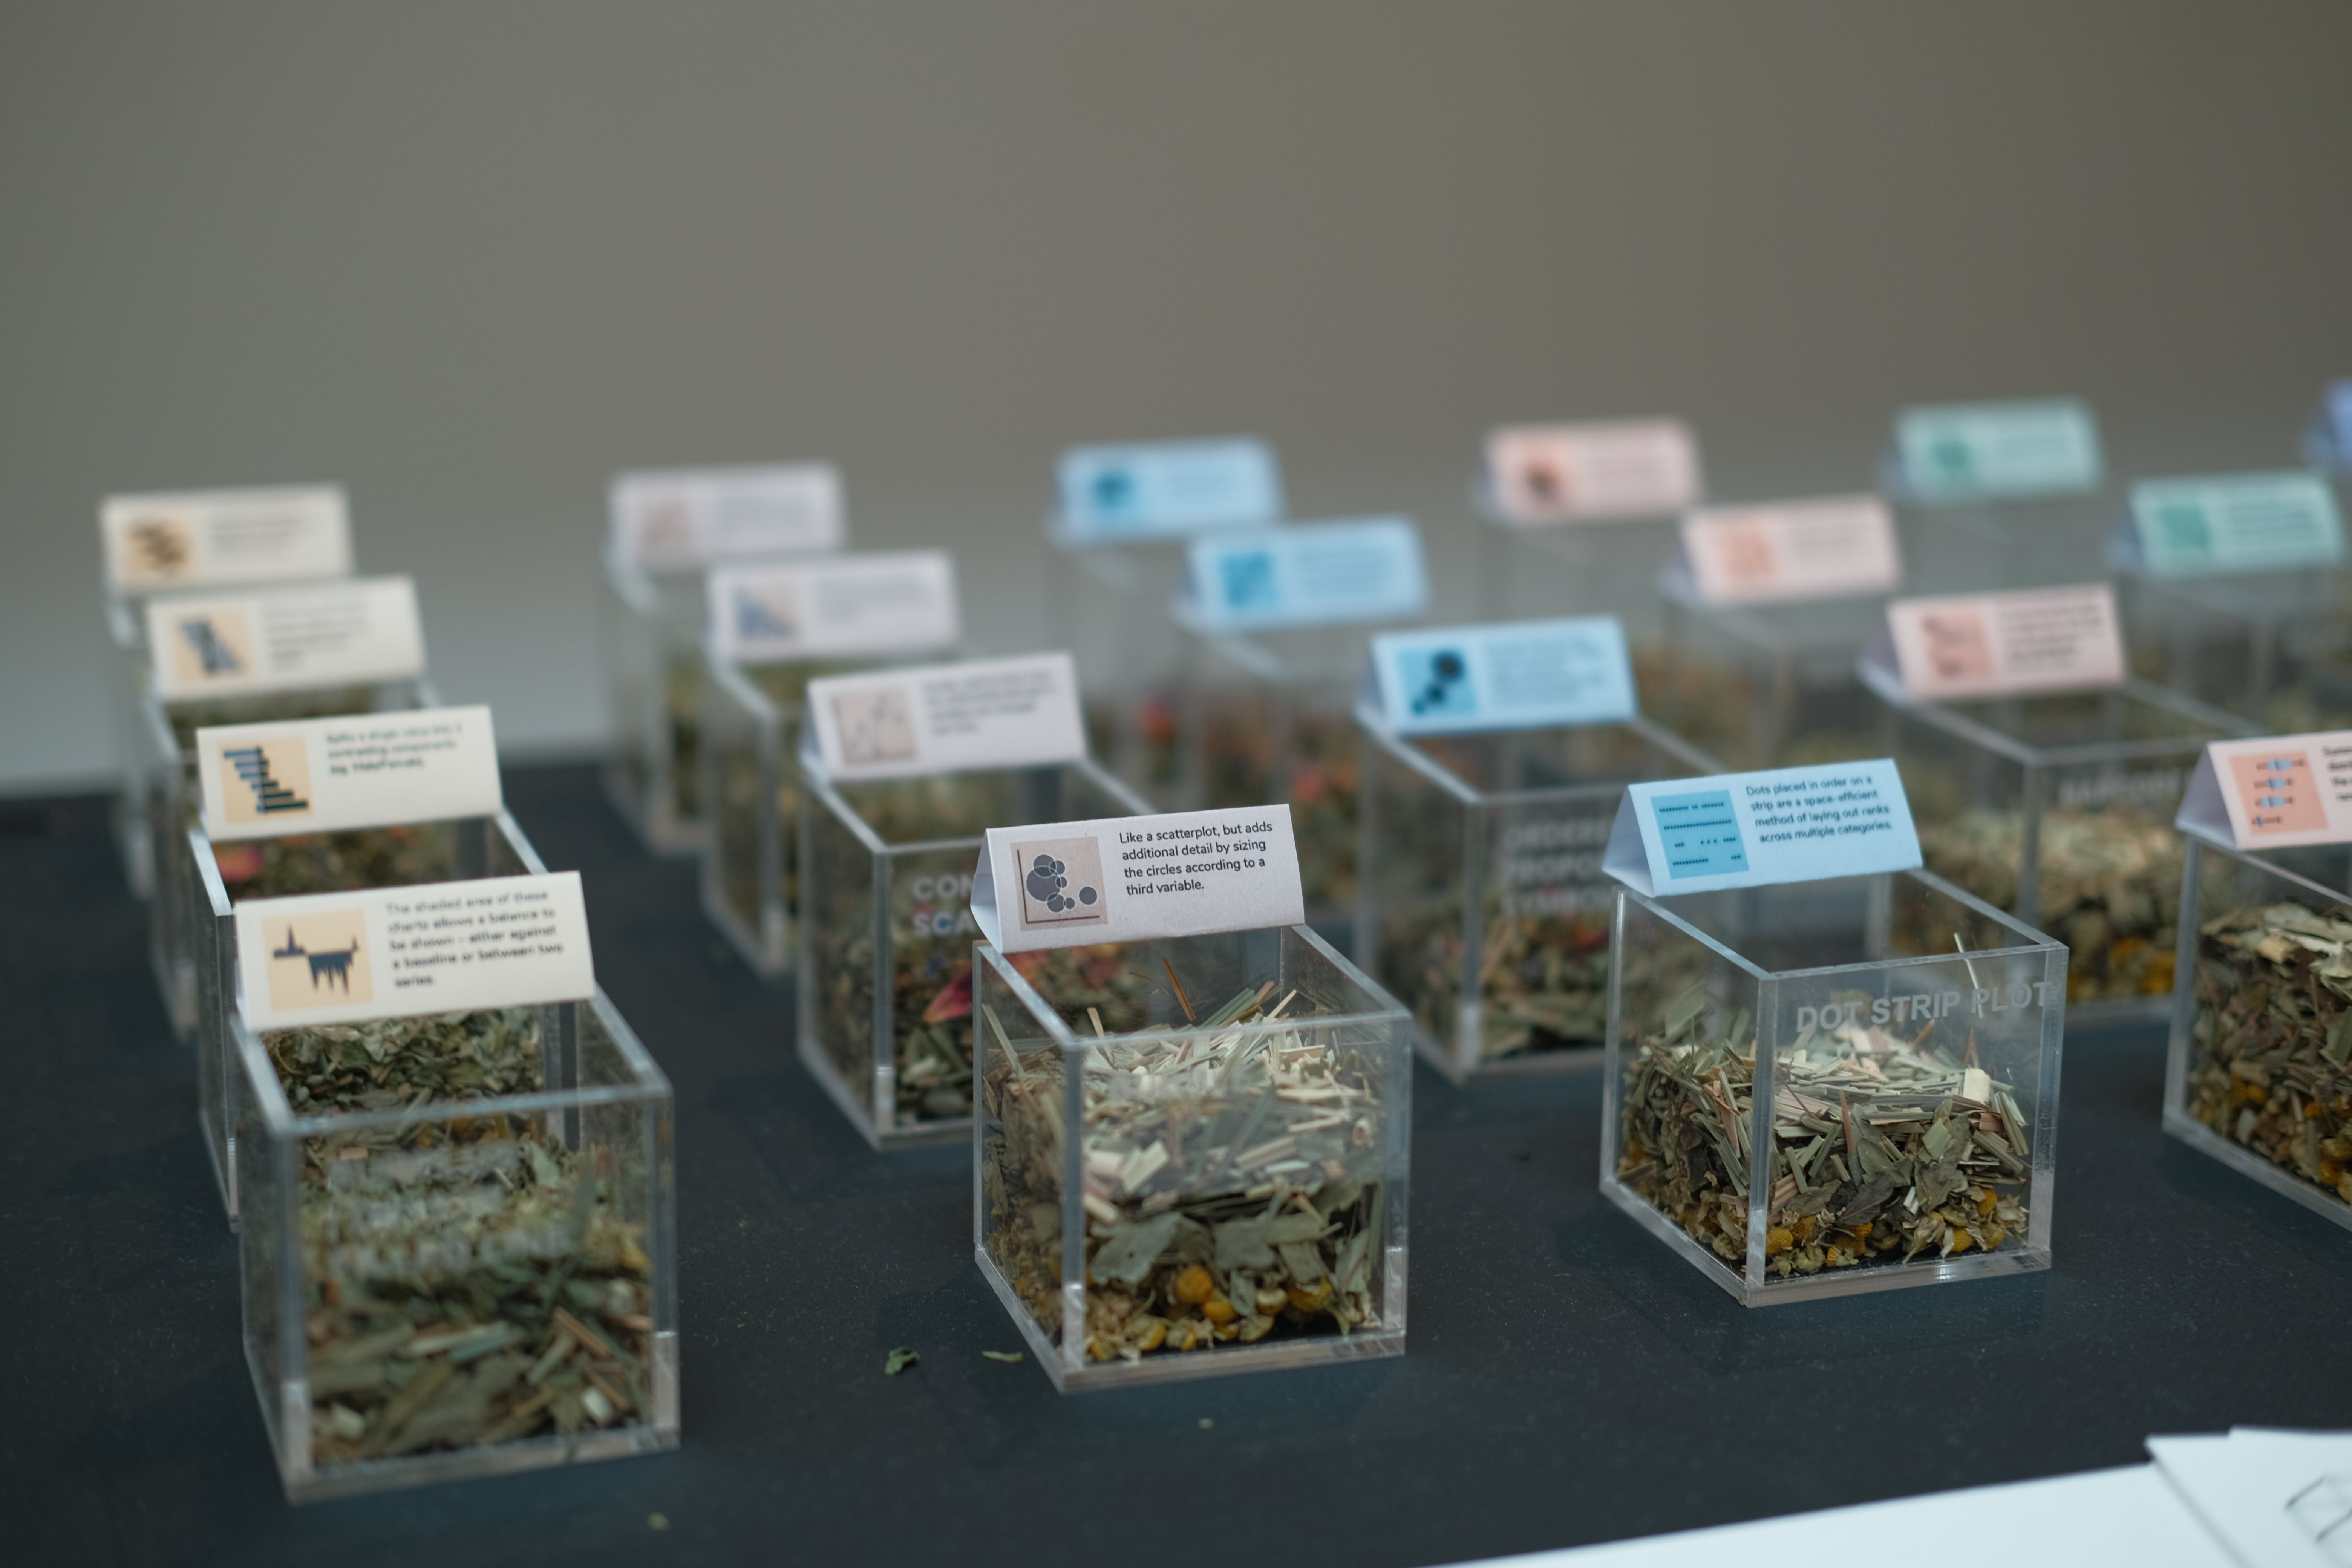
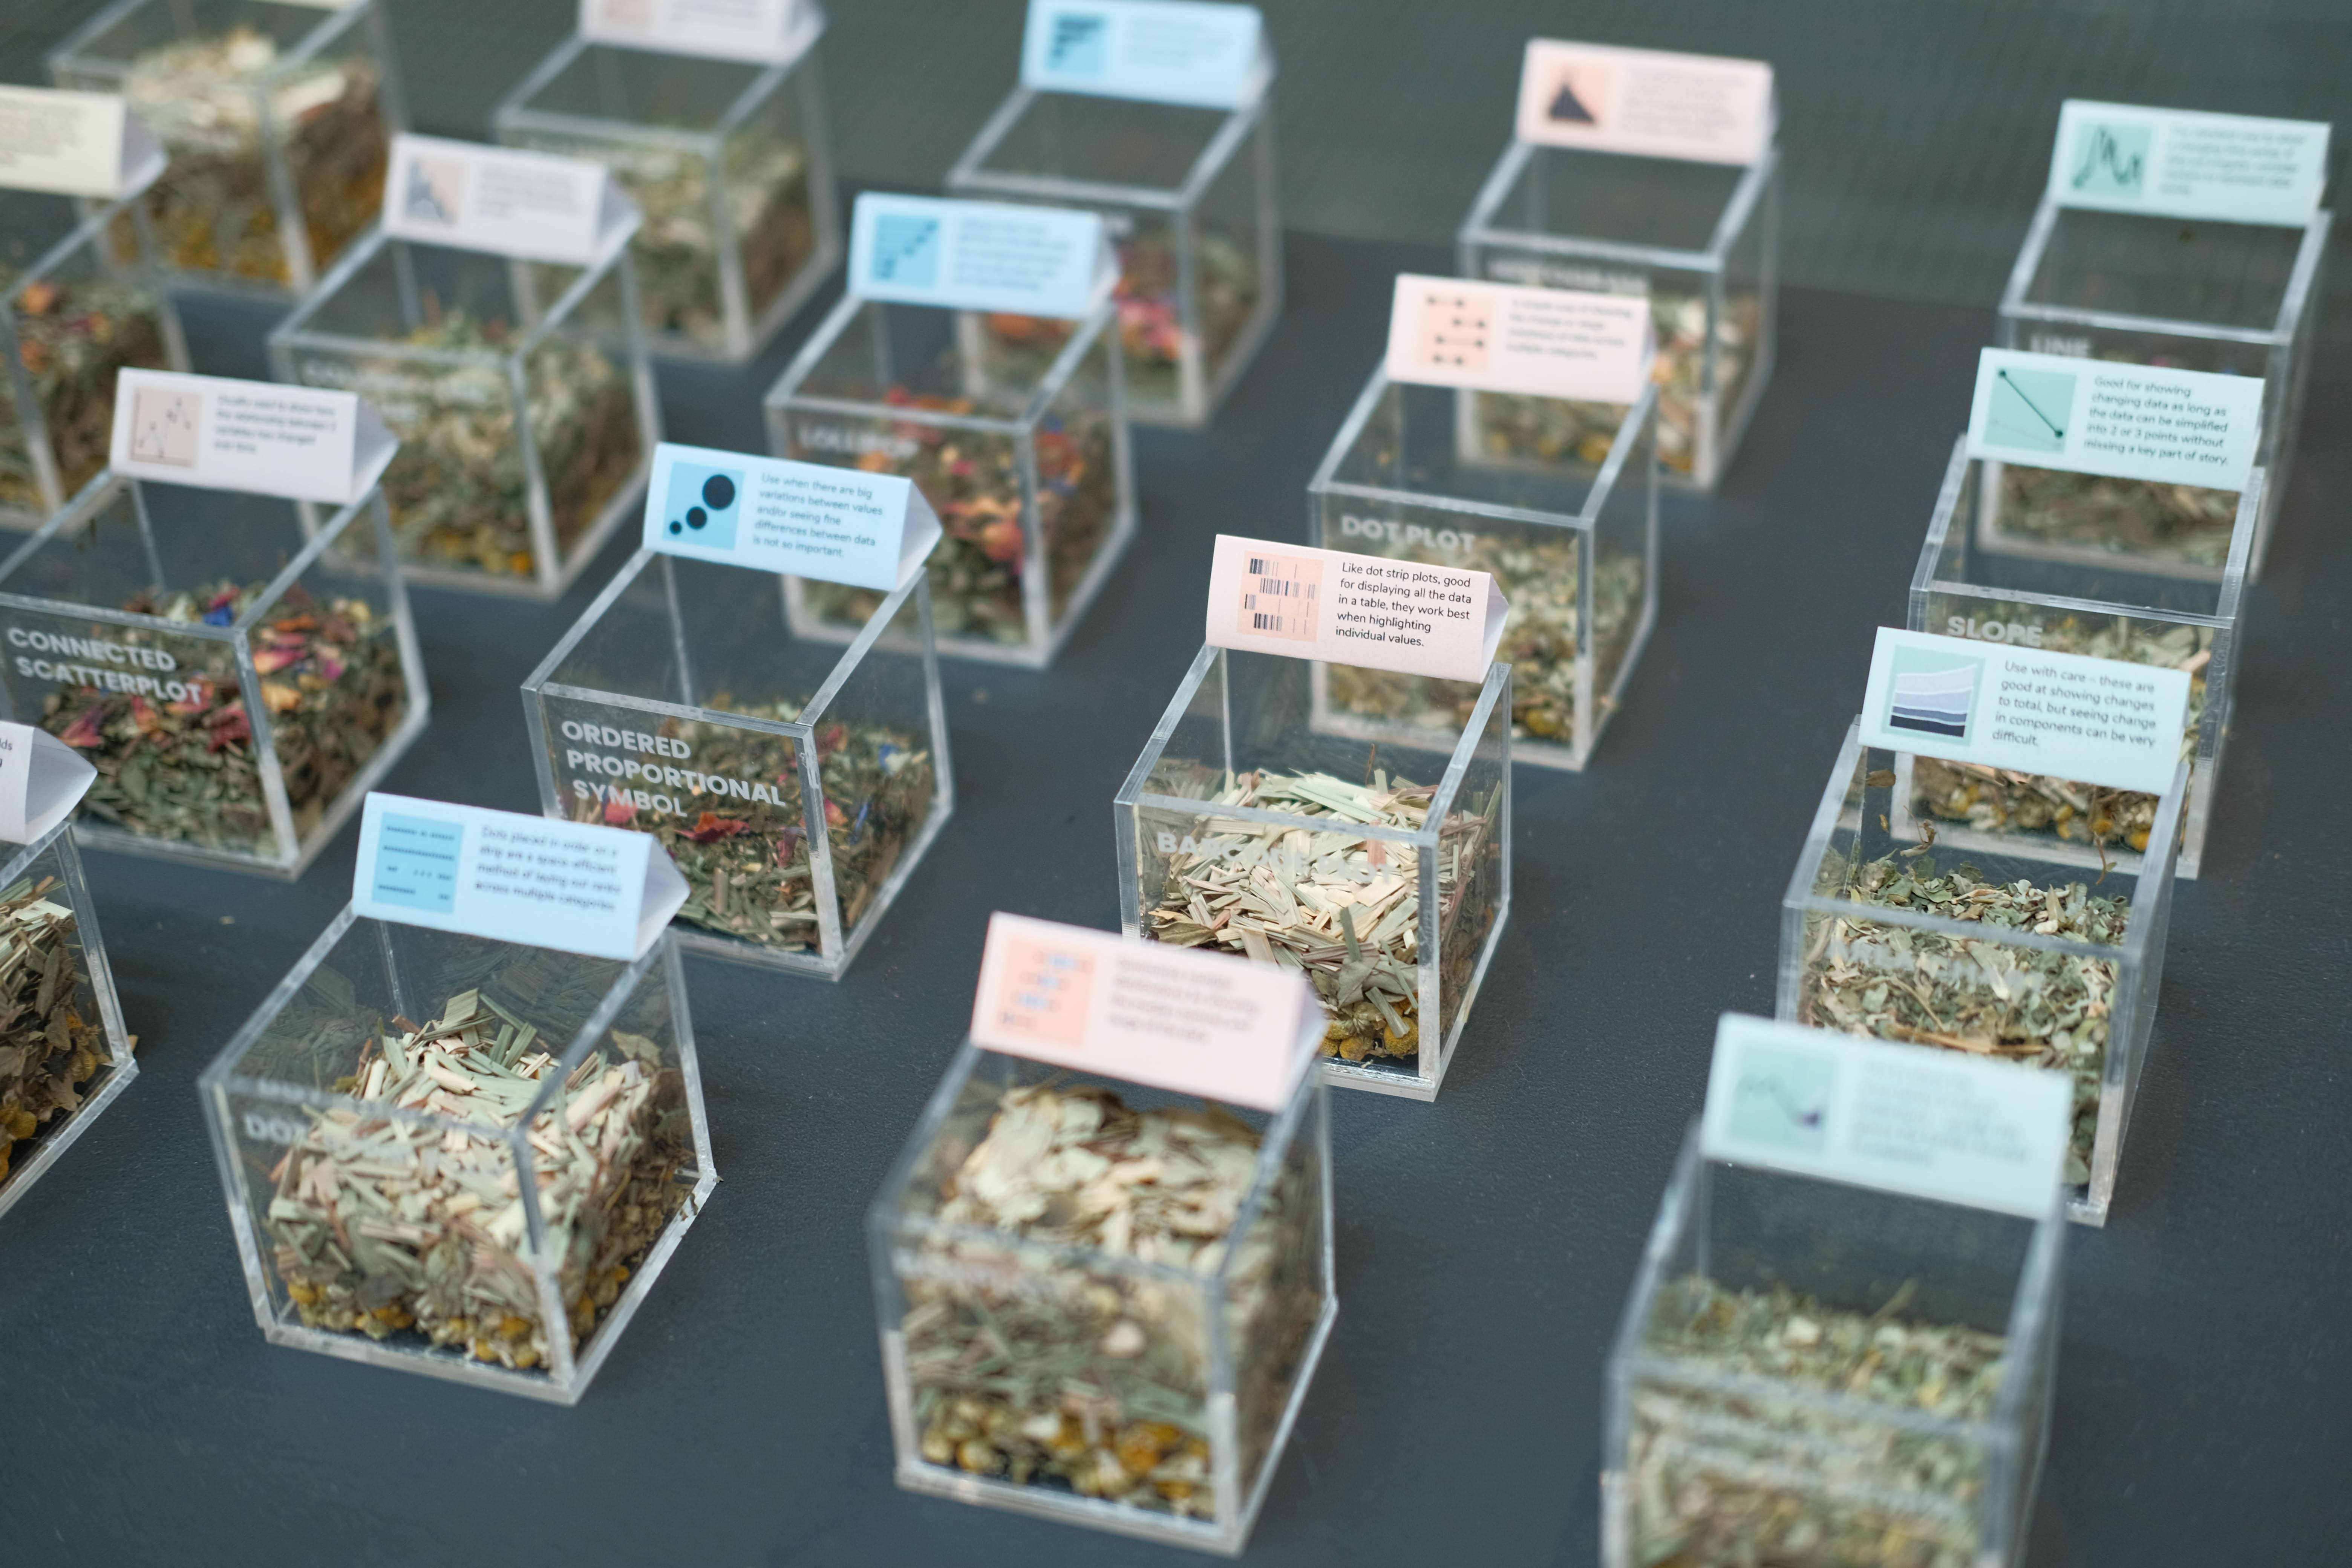
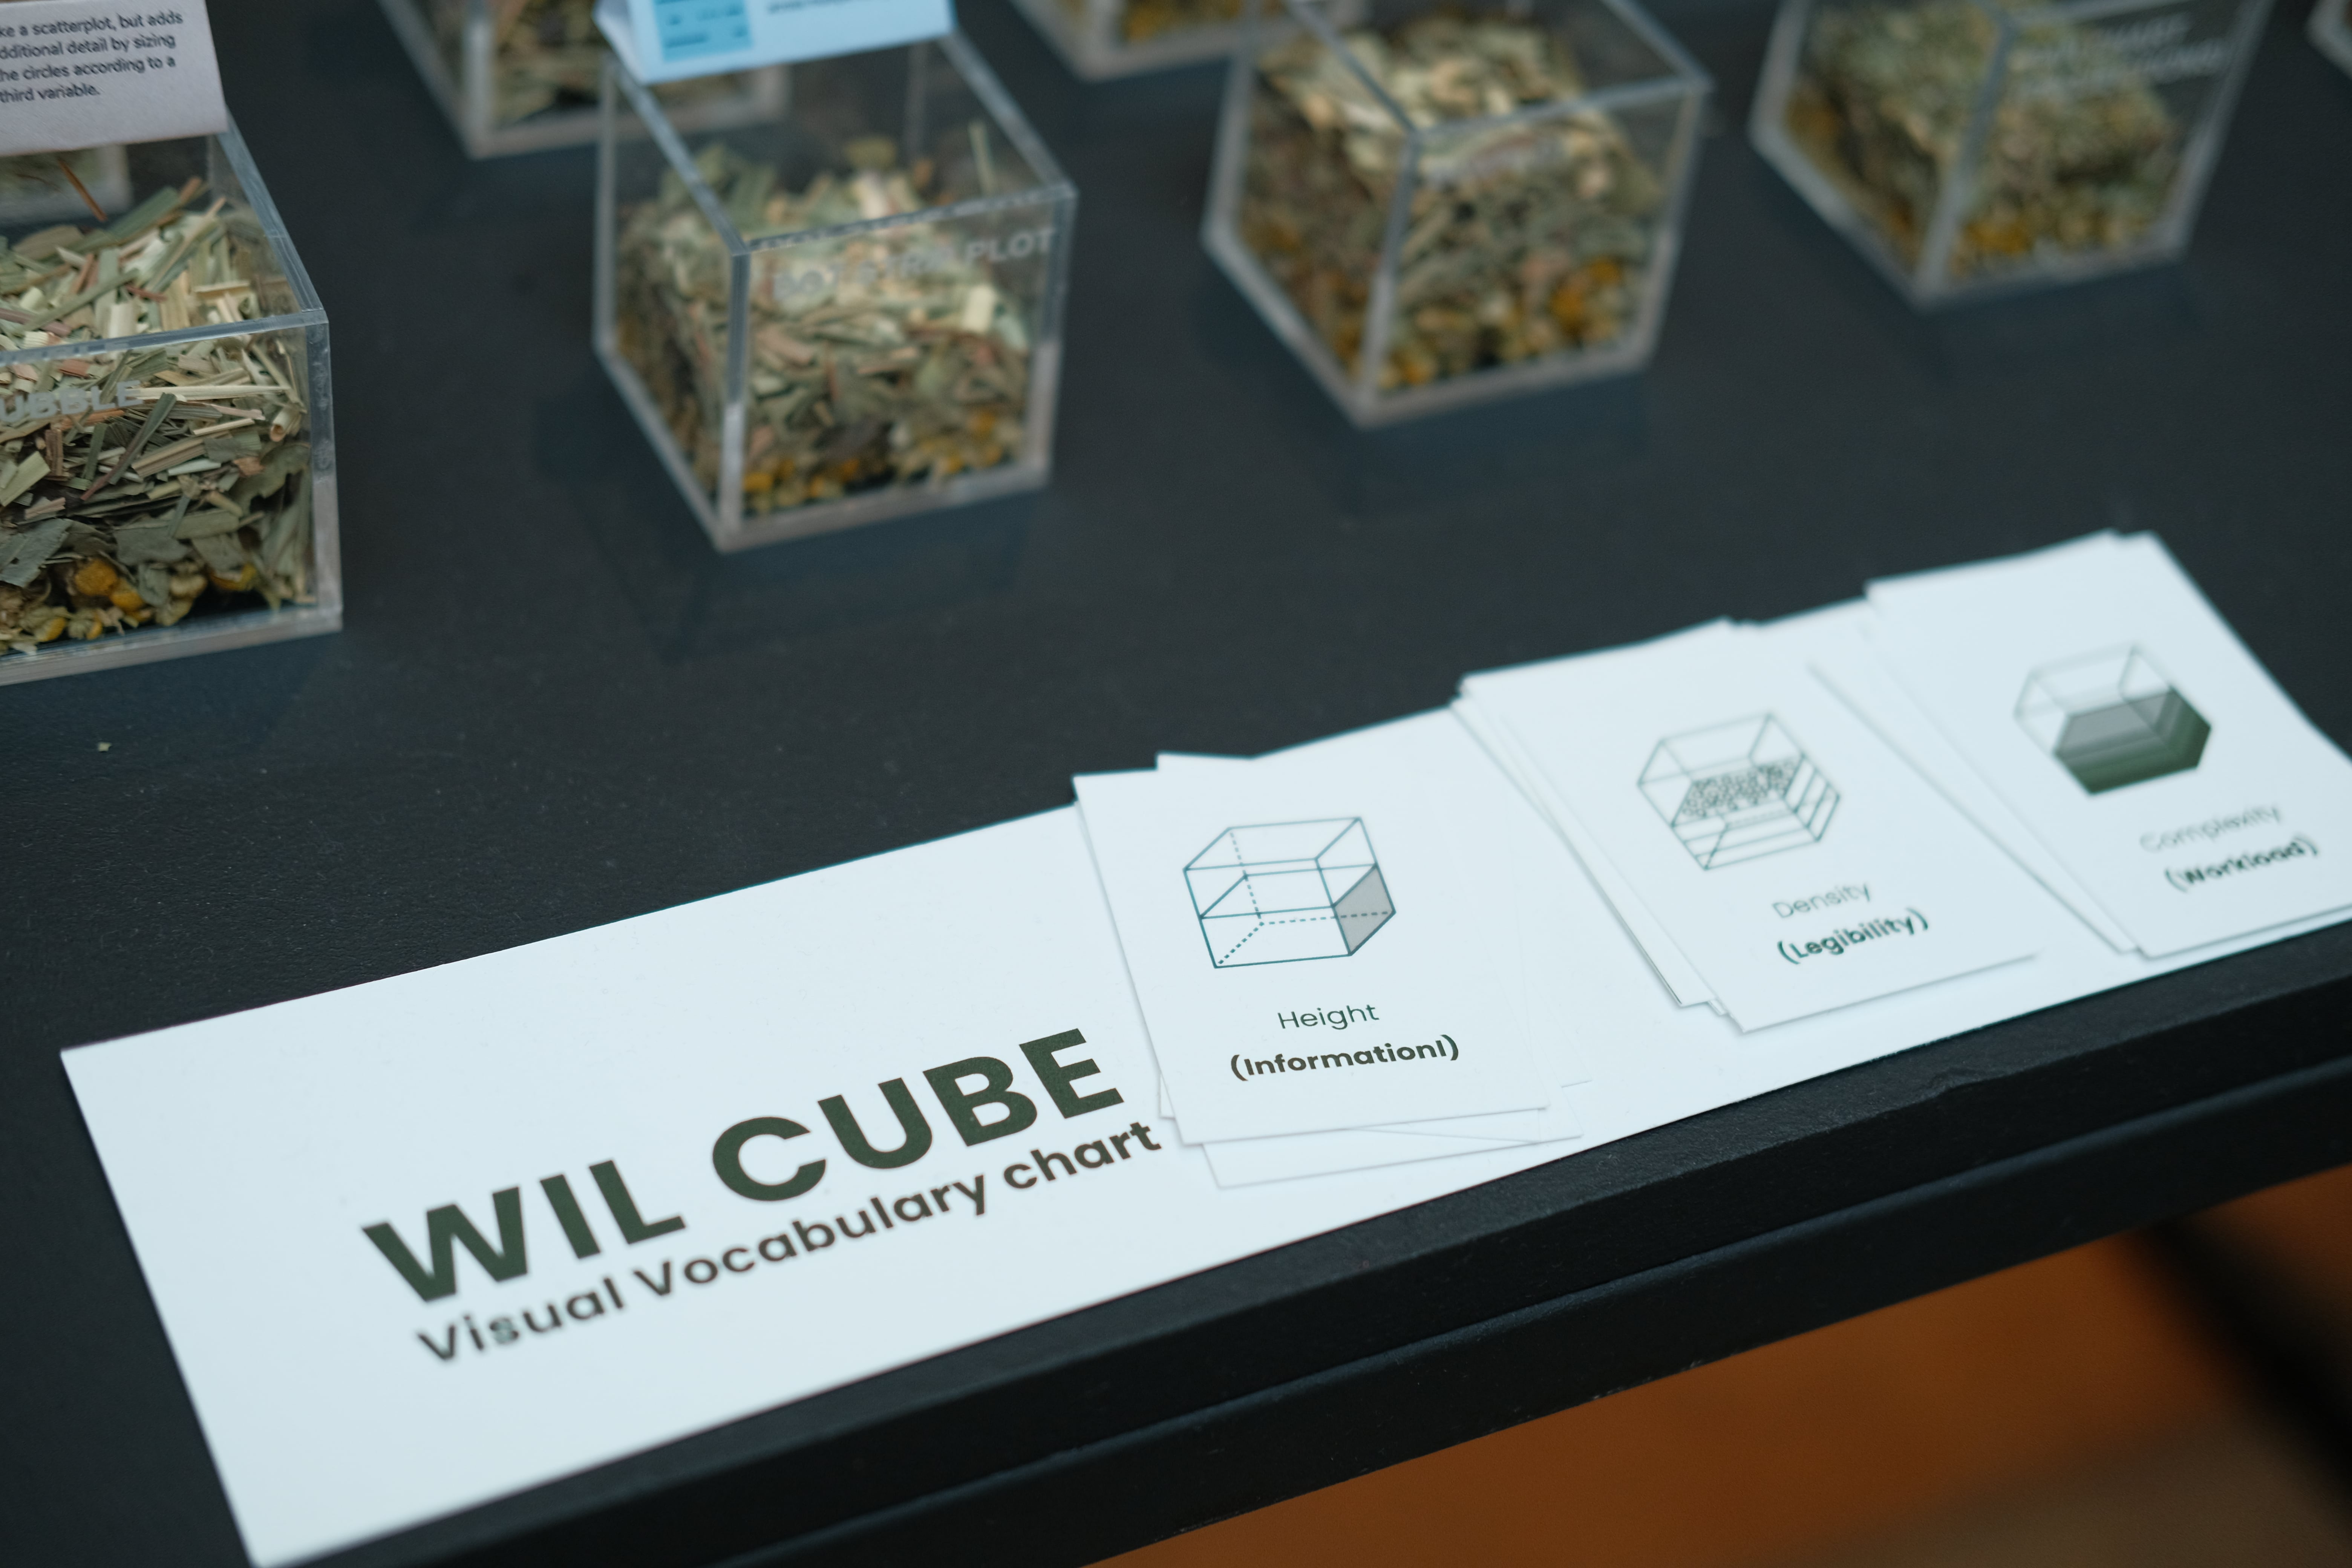
WIL Cube is a cube art installation themed around visual graphics. From the designer's perspective, it evaluates different types of charts based on three dimensions: workload, information volume, and readability. These correspond to the tactile sensation of the material "W," the filling height of the material "I," and the sparsity of the material "L." By observing, touching, and feeling the state of the filling materials, it provides diverse options for novice data visualization designers.
WHAT I DID
Data Visualization, Illustration, Installation, Print, Exhibition
Year
2023

Process
Survey
We first created a questionnaire to collect data and organize it by chart type as a basis for the next steps. We evaluated common charts from three different perspectives (reader, designer, and the data itself) to expand our understanding of different chart types.
Initially, we used wood as the material and designed our components based on triangles. The texture and plasticity of the wood allowed the audience to associate the three properties of the charts with corresponding visual and tactile sensations. We aimed for the audience to feel the data size through the roughness of the surface texture. Thus, we initially created a four-sided pyramid with smoother surfaces and rounded corners for frequently used charts.
Problems and Challenges
During the pyramid-making process, we encountered some issues because we wanted to differentiate the pyramids by material texture. 3D-printed plastic models did not meet our needs, so we had to glue and cut wood pieces layer by layer. However, the cutting process was not precise, and some pyramids had missing corners. Based on the feedback we received, we found that it was difficult for the audience to distinguish different data types solely by touch.
Solution
We switched the material to acrylic and different types of tea, replacing triangles with cubes. The plastic cubes were filled with tea and spices, symbolizing the intrinsic connection between data and charts. This change expanded the single tactile experience to include visual, olfactory, and tactile dimensions to correspond to three different data types, addressing the feedback issues and further expanding the expressive forms of our art installation.
OUTCOME


